
Google Analytics 4 (GA4) has released a dashboards feature that lets you create three types of custom reports:
- Dashboard
- Detailed report
- Overview report
To create these reports, go to the Reports section, click the Create icon, and select the type of report you want to create.
Here’s an overview of each report type.
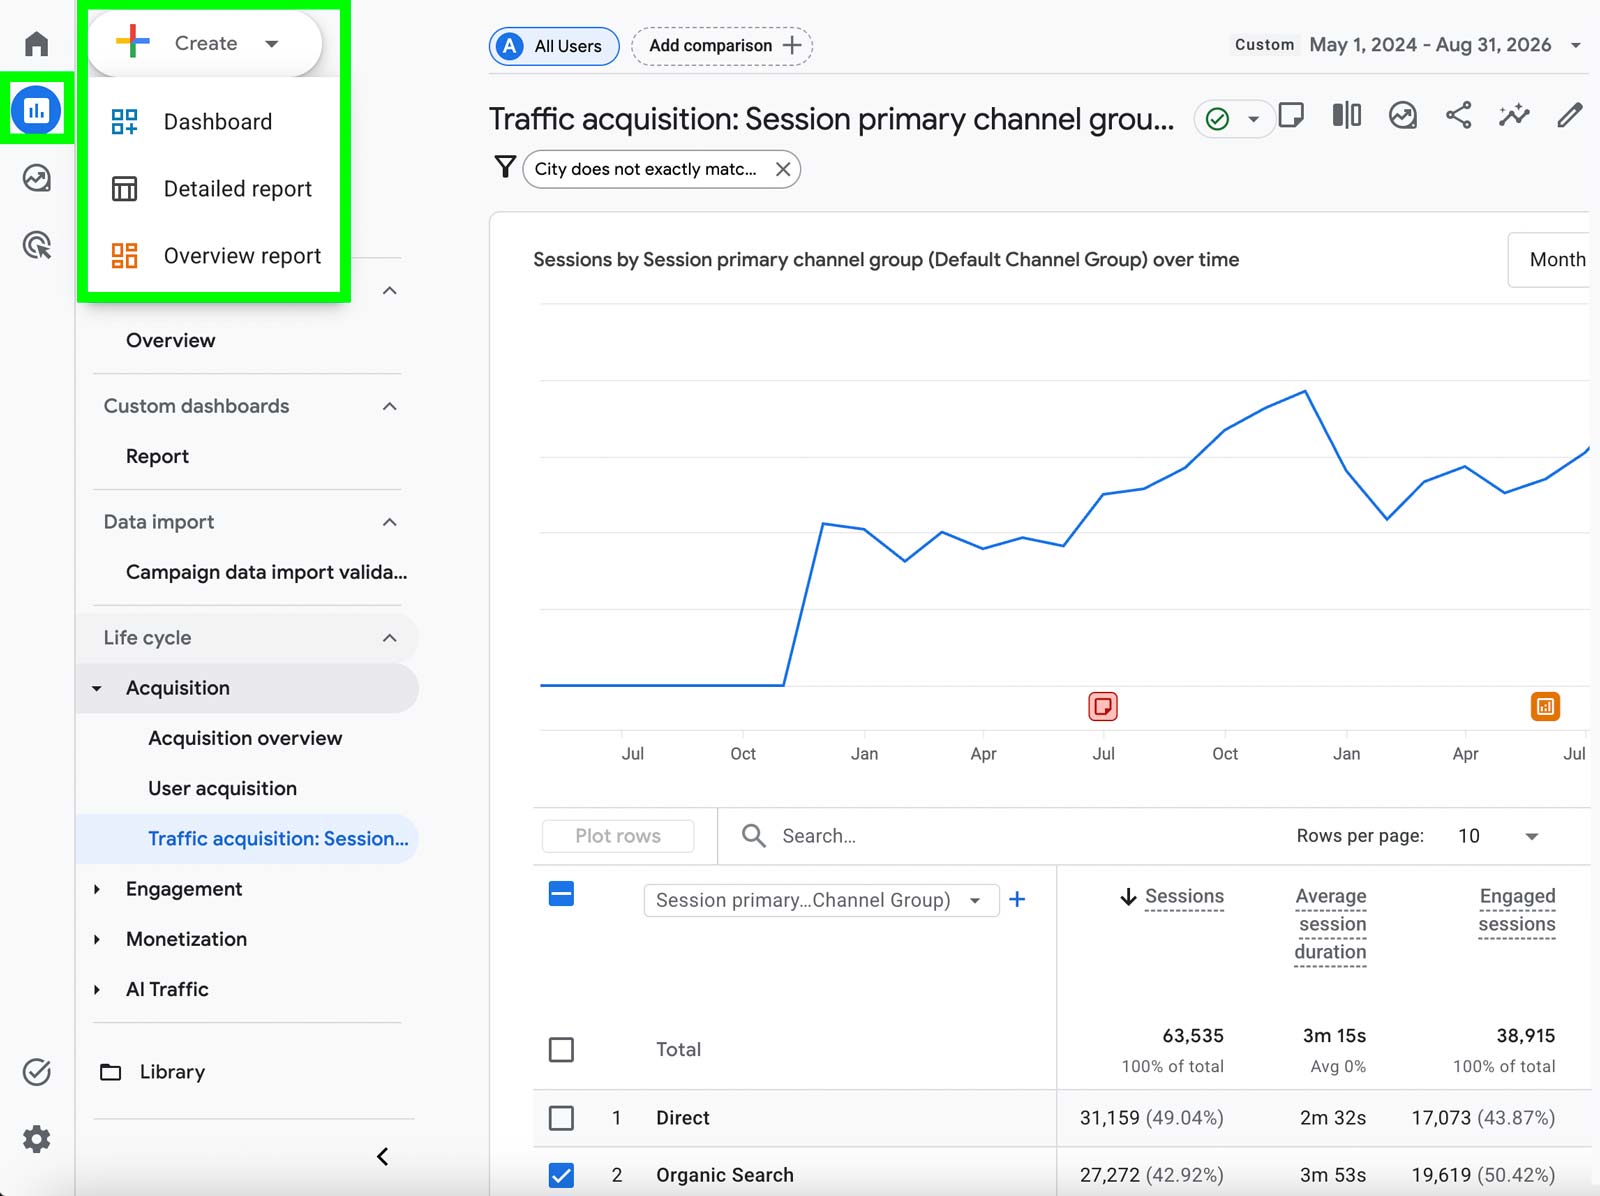
Here’s an overview of each report type.
- Dashboard
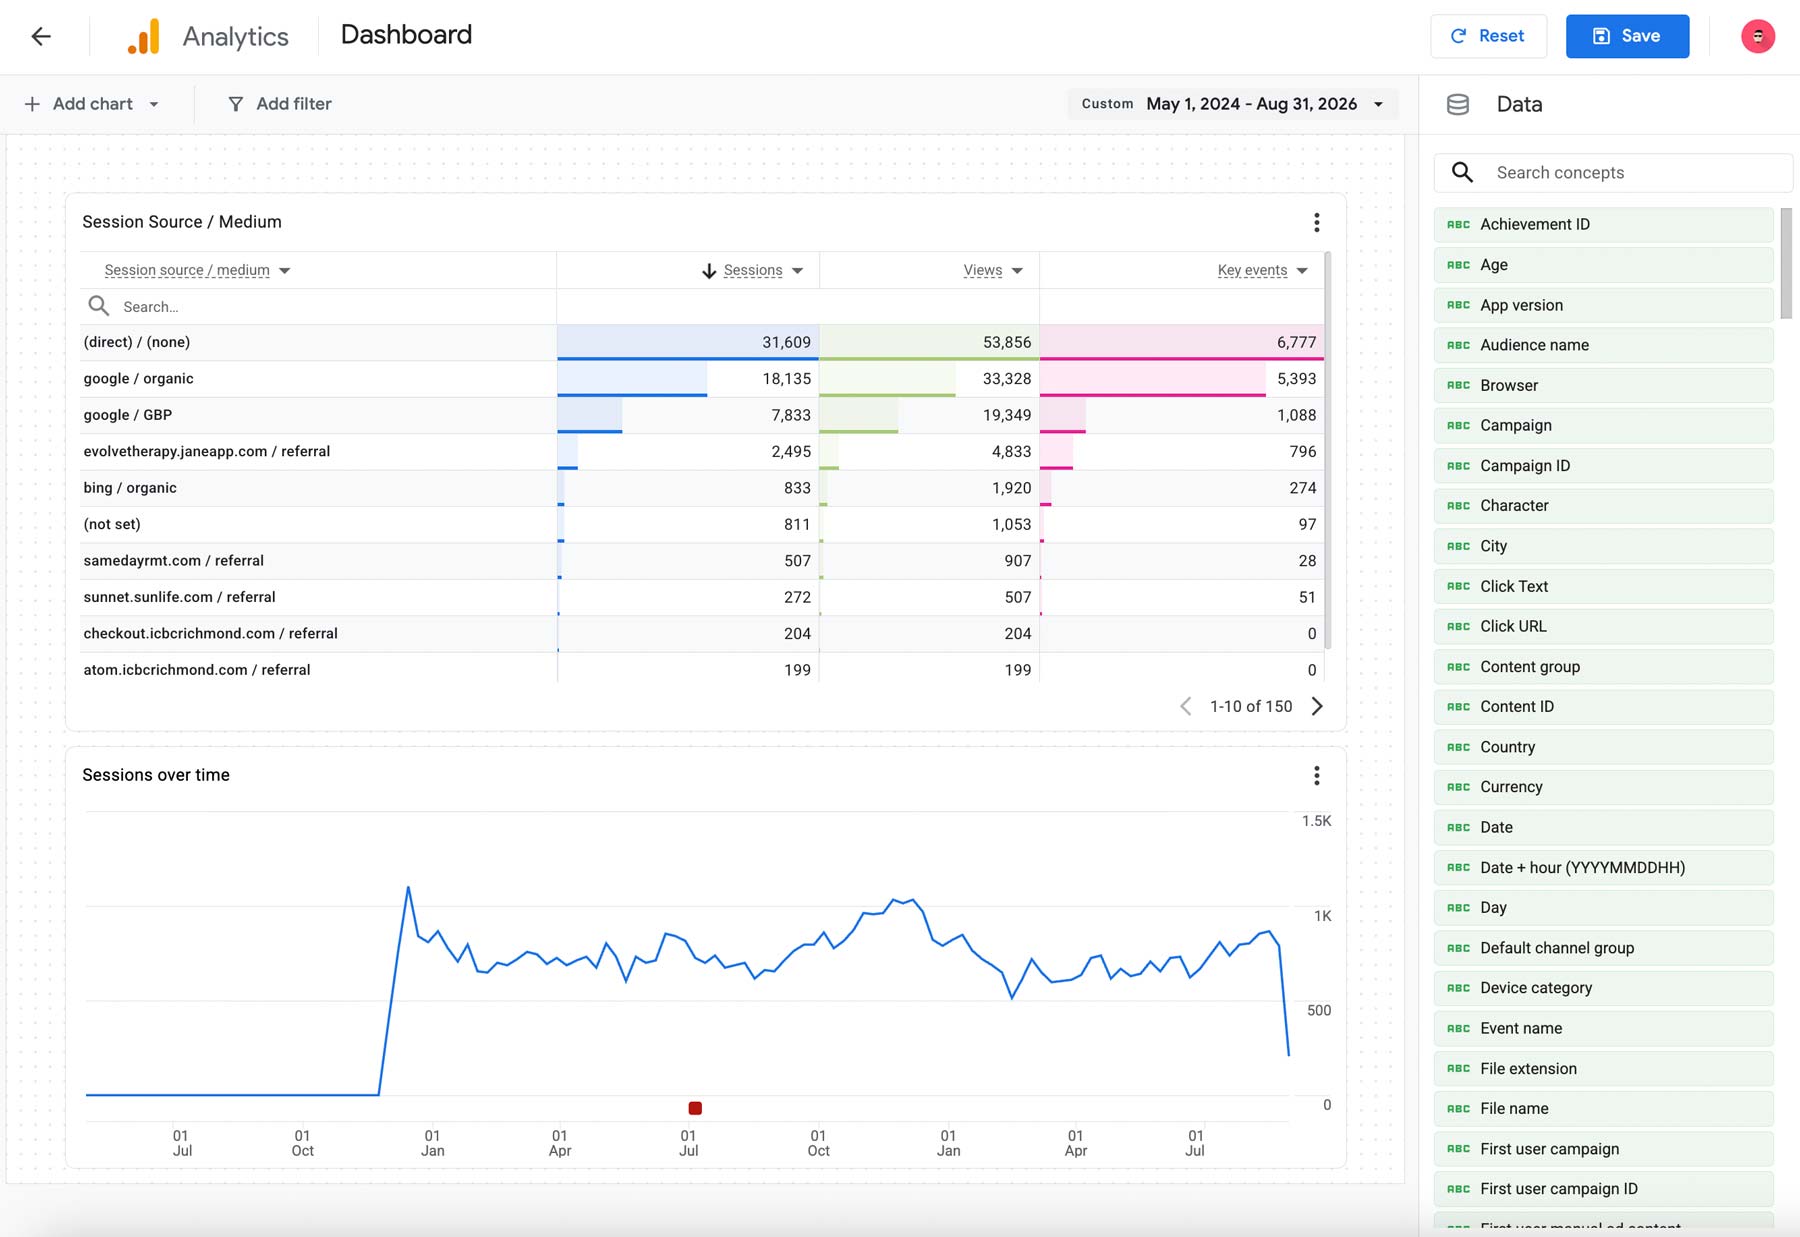
The Dashboard report lets you build multiple charts so you can gain an overview of your data based on the specific dimensions you’ve set.
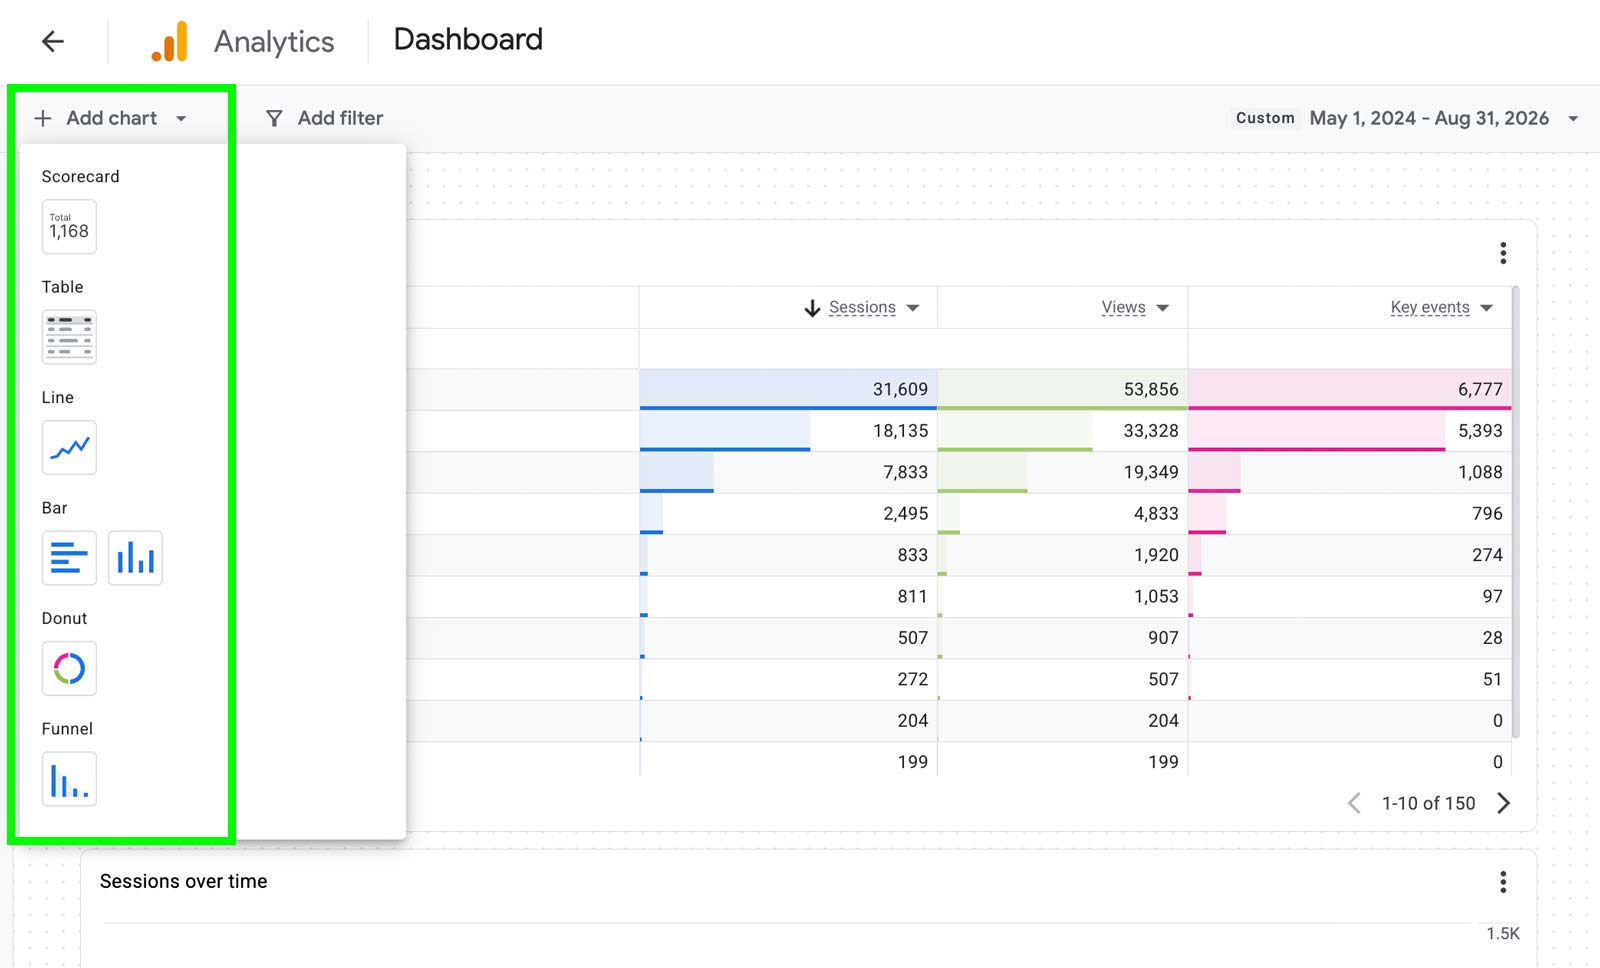
To create a chart, click Add chart on the top left-hand side and select the type of chart you want to add to the dashboard.
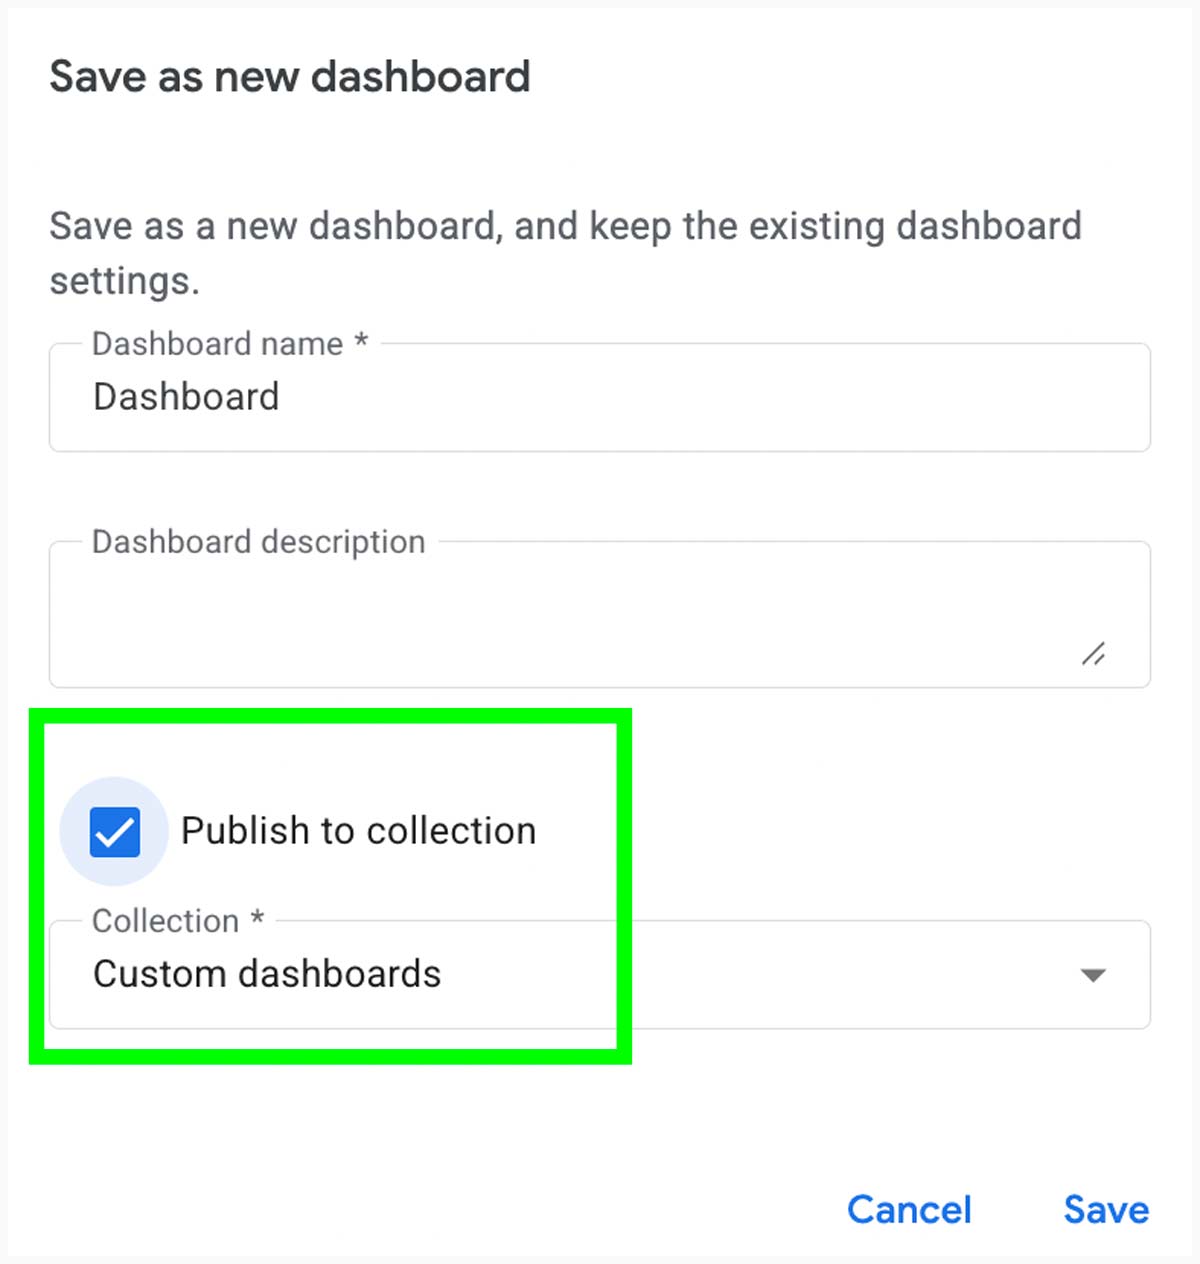
Once you’ve created the report, make sure to select Publish to collection.
- Detailed report
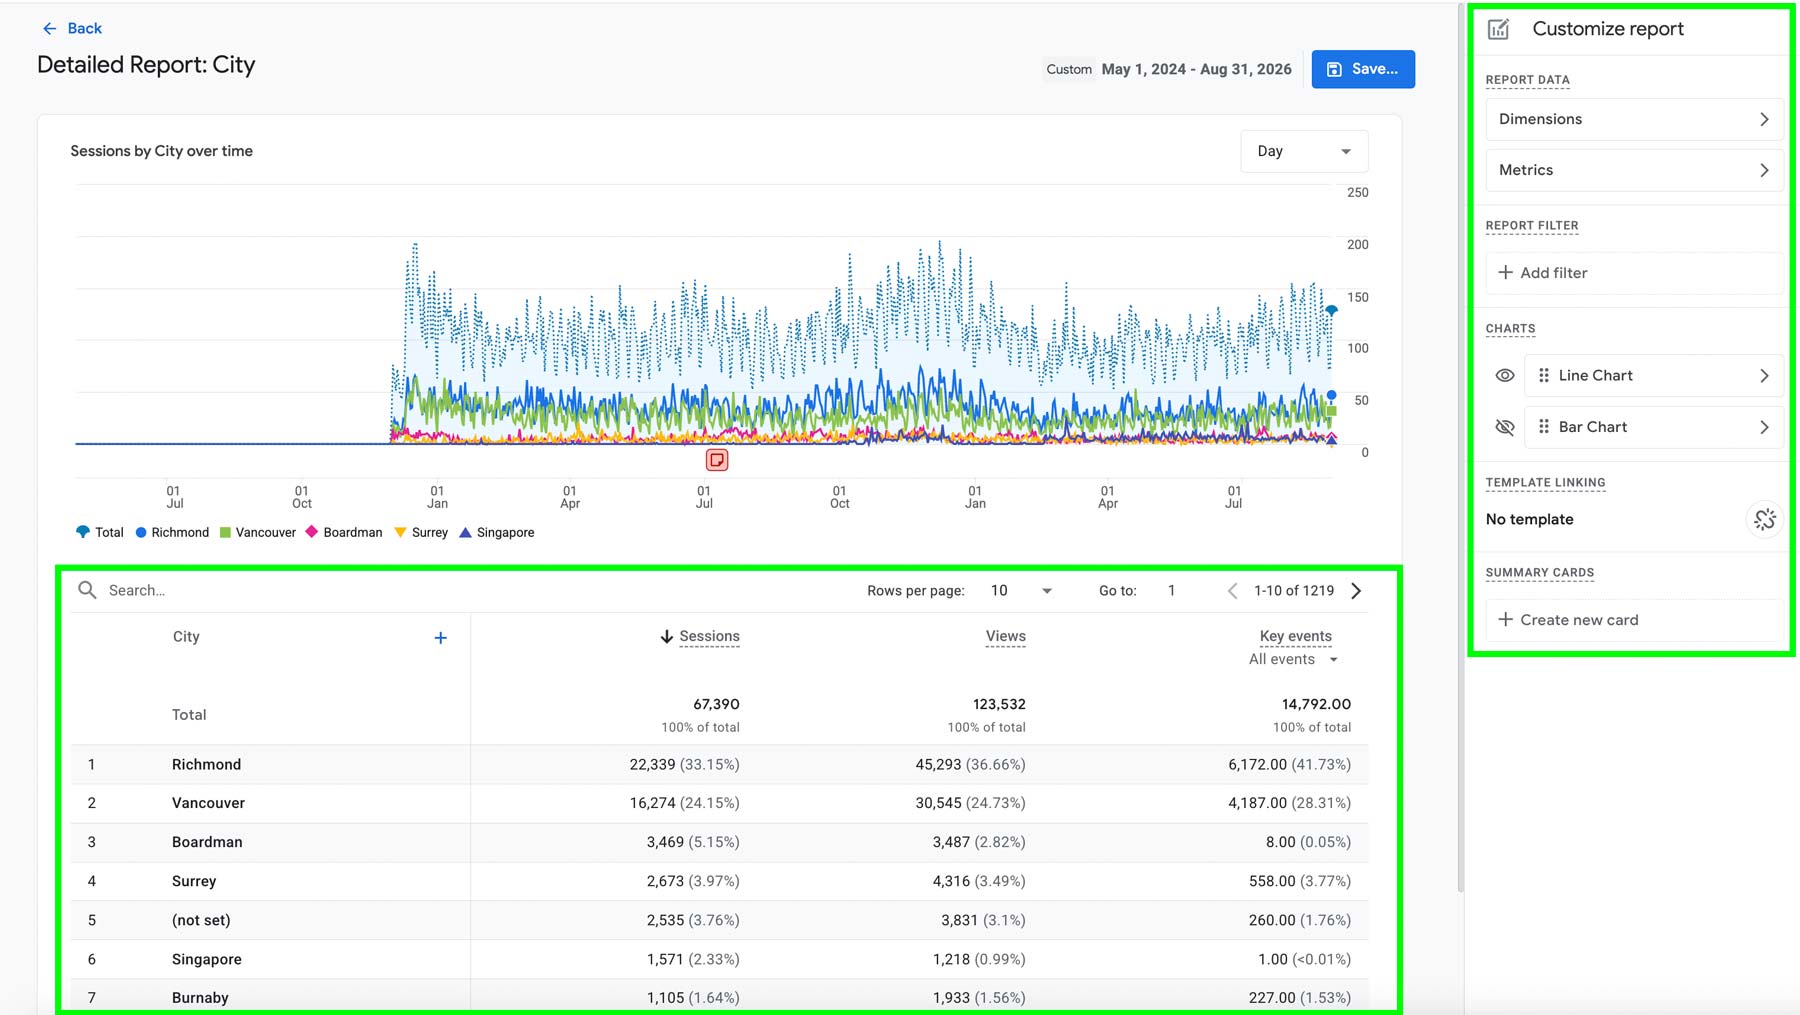
A Detailed report is the same as a GA4 standard report. You can create a detailed report by adding a dimension, such as City, and metrics, such as Sessions, Views, and Key Events. A Detailed report is useful if the out-of-the-box standard reports don’t fulfill your needs and you want to develop your own standard reports based on your analytics needs.
- Overview report
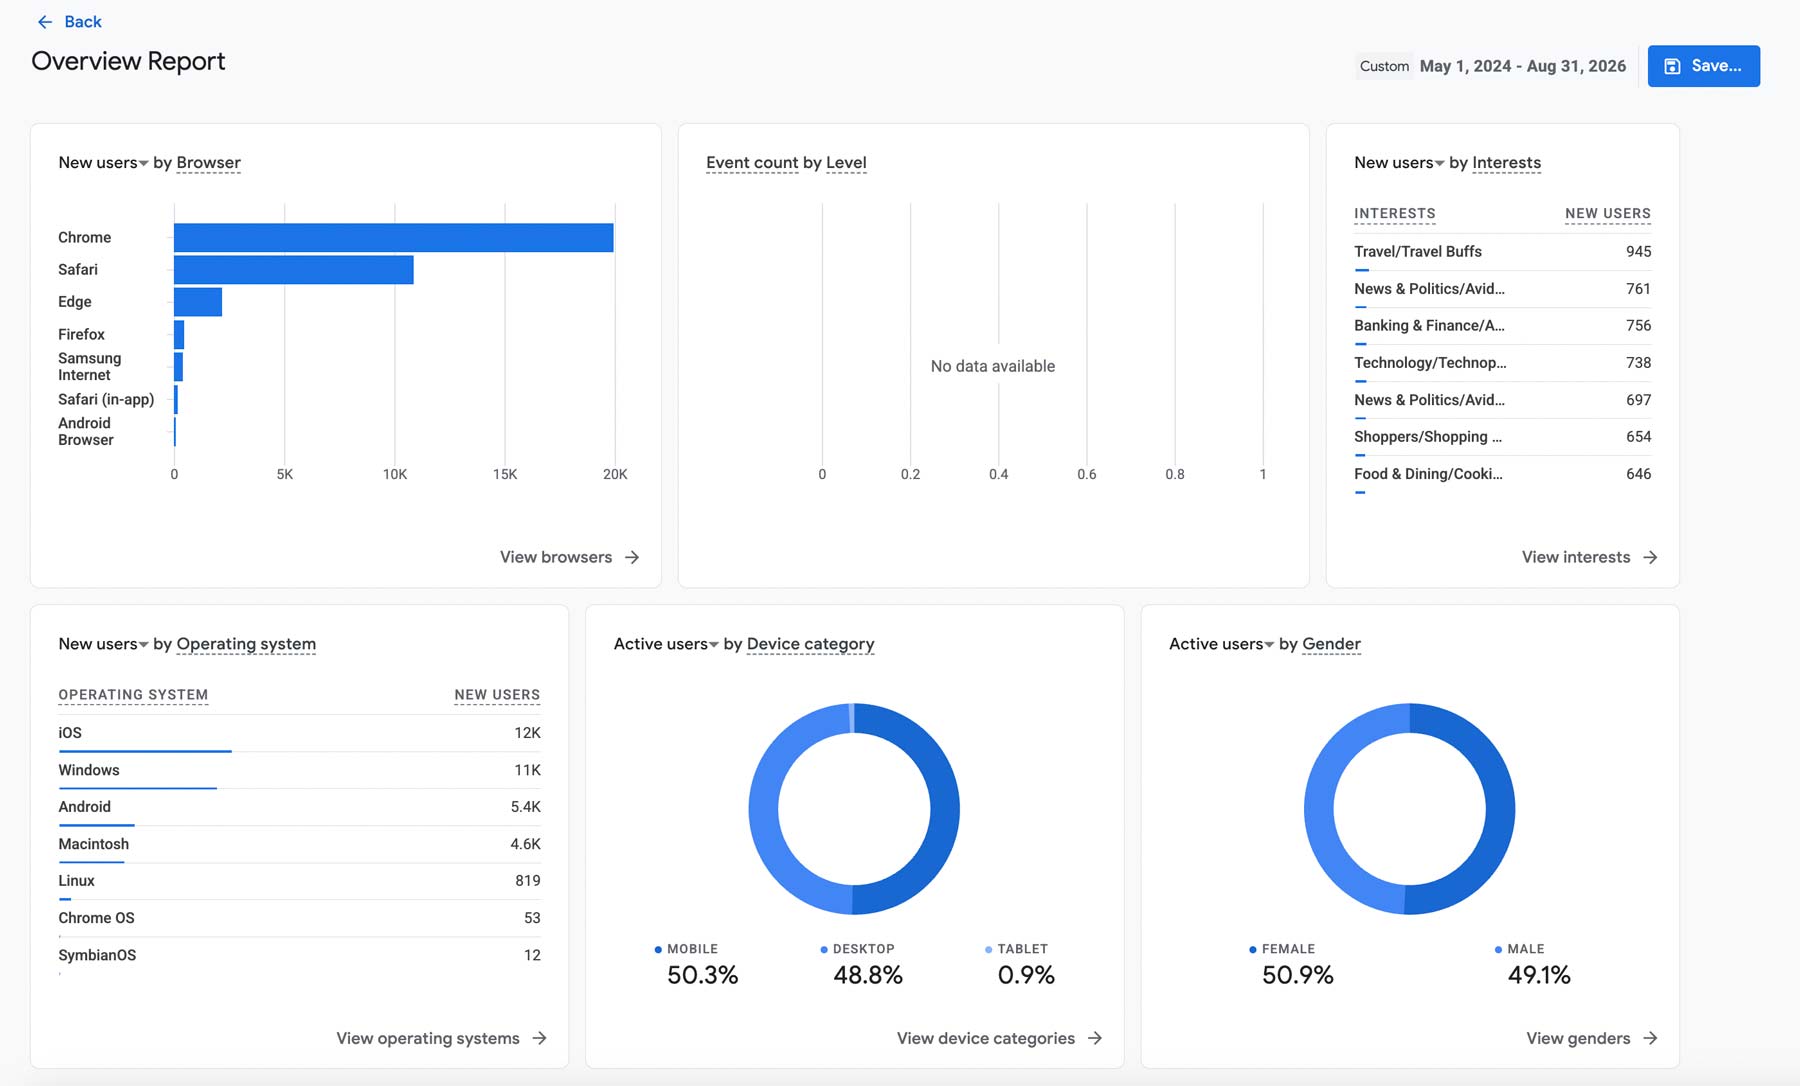
The Overview report lets you add cards based on different dimensions and metrics so you can see your website performance from various angles.
To create an Overview report, click Add a card and select the cards you want to include in your Overview report.


If you have any questions about GA4 dashboards, please get in touch and we’ll be happy to help!