

Website engagement goes beyond page views. Analyzing how users interact with content or webpages helps us uncover insights, optimize performance, and improve our digital strategy. This is made possible through Google Analytics 4.
Here’s how you can measure your content performance and user engagement using Google Analytics 4!
How to Analyze Content Performance Using Google Analytics 4
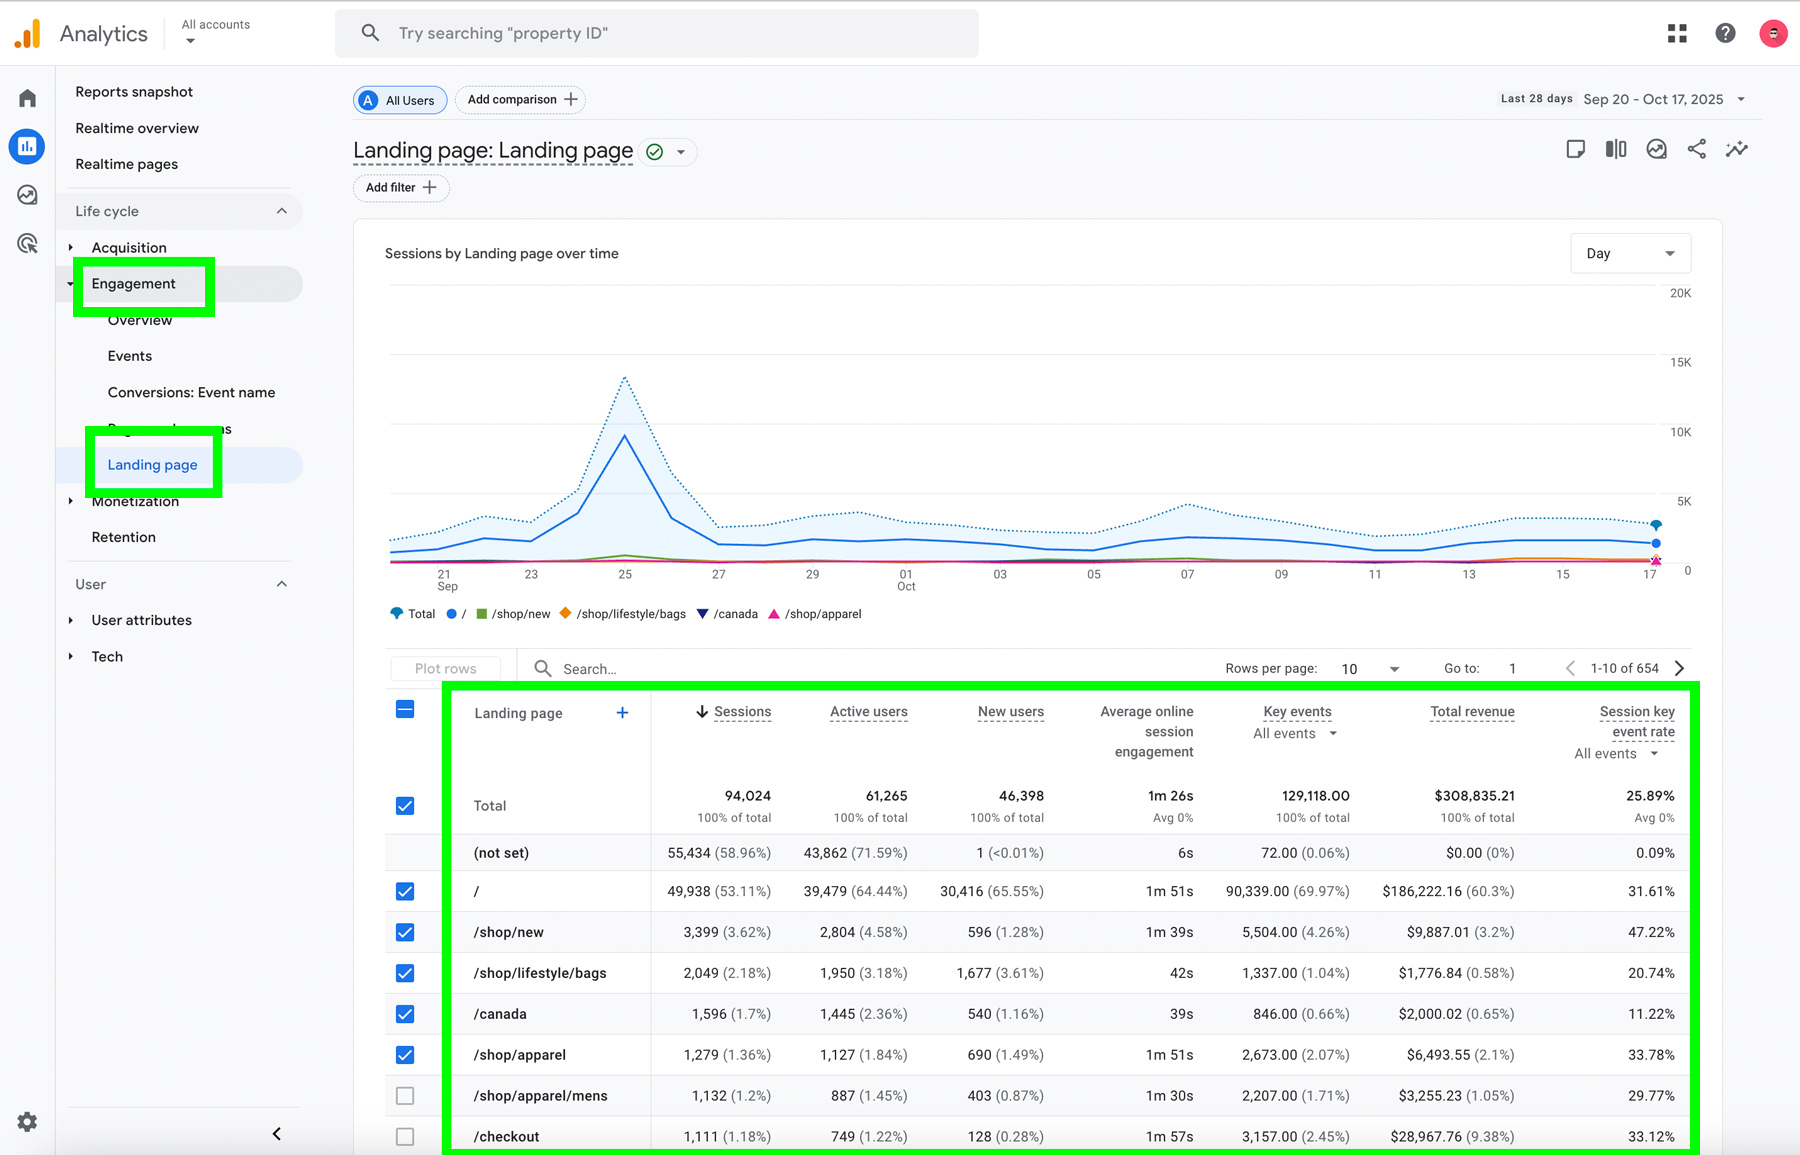
Landing Pages Report
The Landing Page report shows you the first page visitors land on when they arrive at your website. It also gives you helpful data like how many people visited those pages, how long they stayed, and how many key actions they took.
For example, you can see metrics such as sessions, new users, average session duration, and key events for each landing page.
You can take things a step further by adding secondary dimensions to see where that traffic is coming from. Try selecting Source / Medium. This lets you see which channels are driving visitors to your site, like google / organic, google / cpc, or direct / (none).
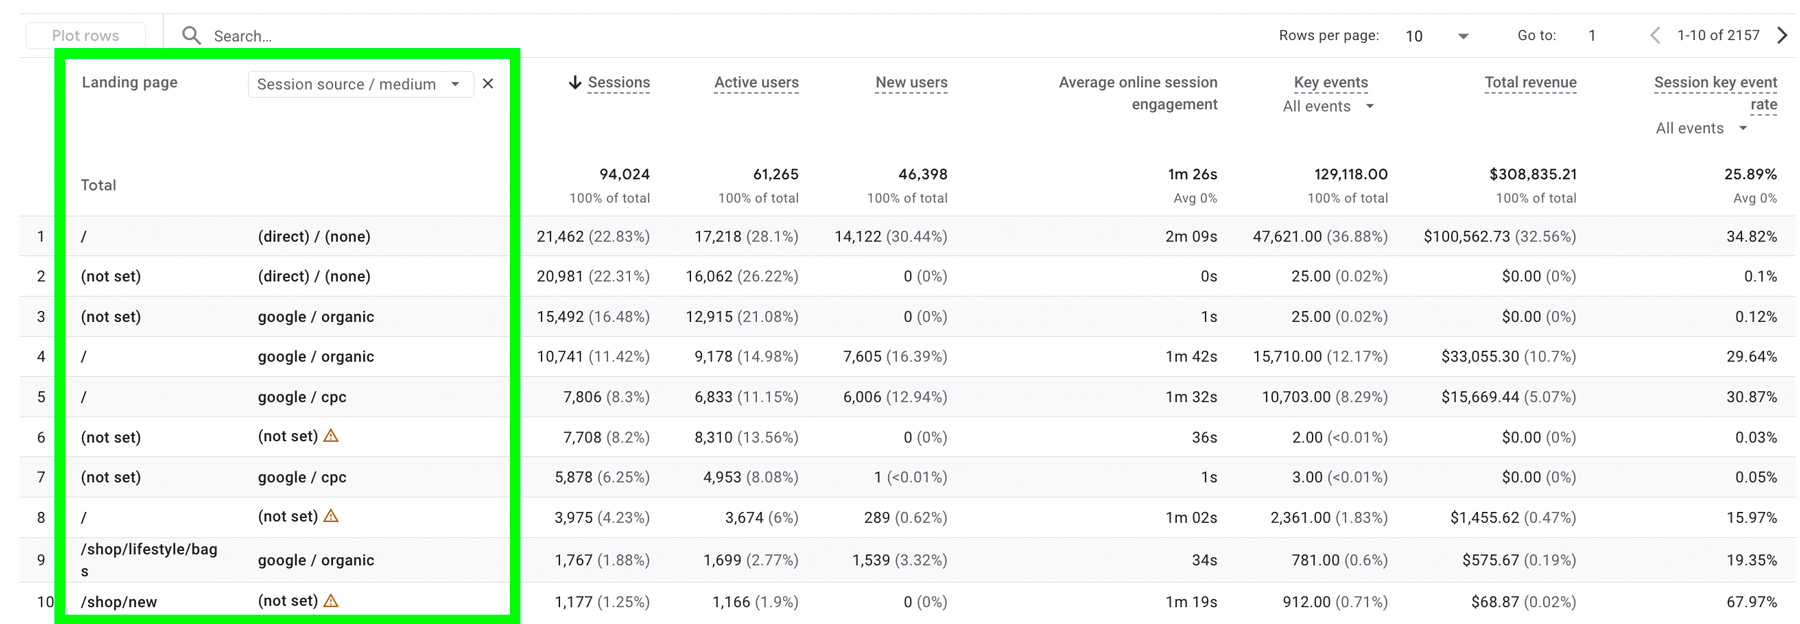
These insights help you understand which pages people are landing on, whether they’re engaging or converting, and which online channels are sending them your way. From there, you can make smart optimizations to improve your top-performing pages.
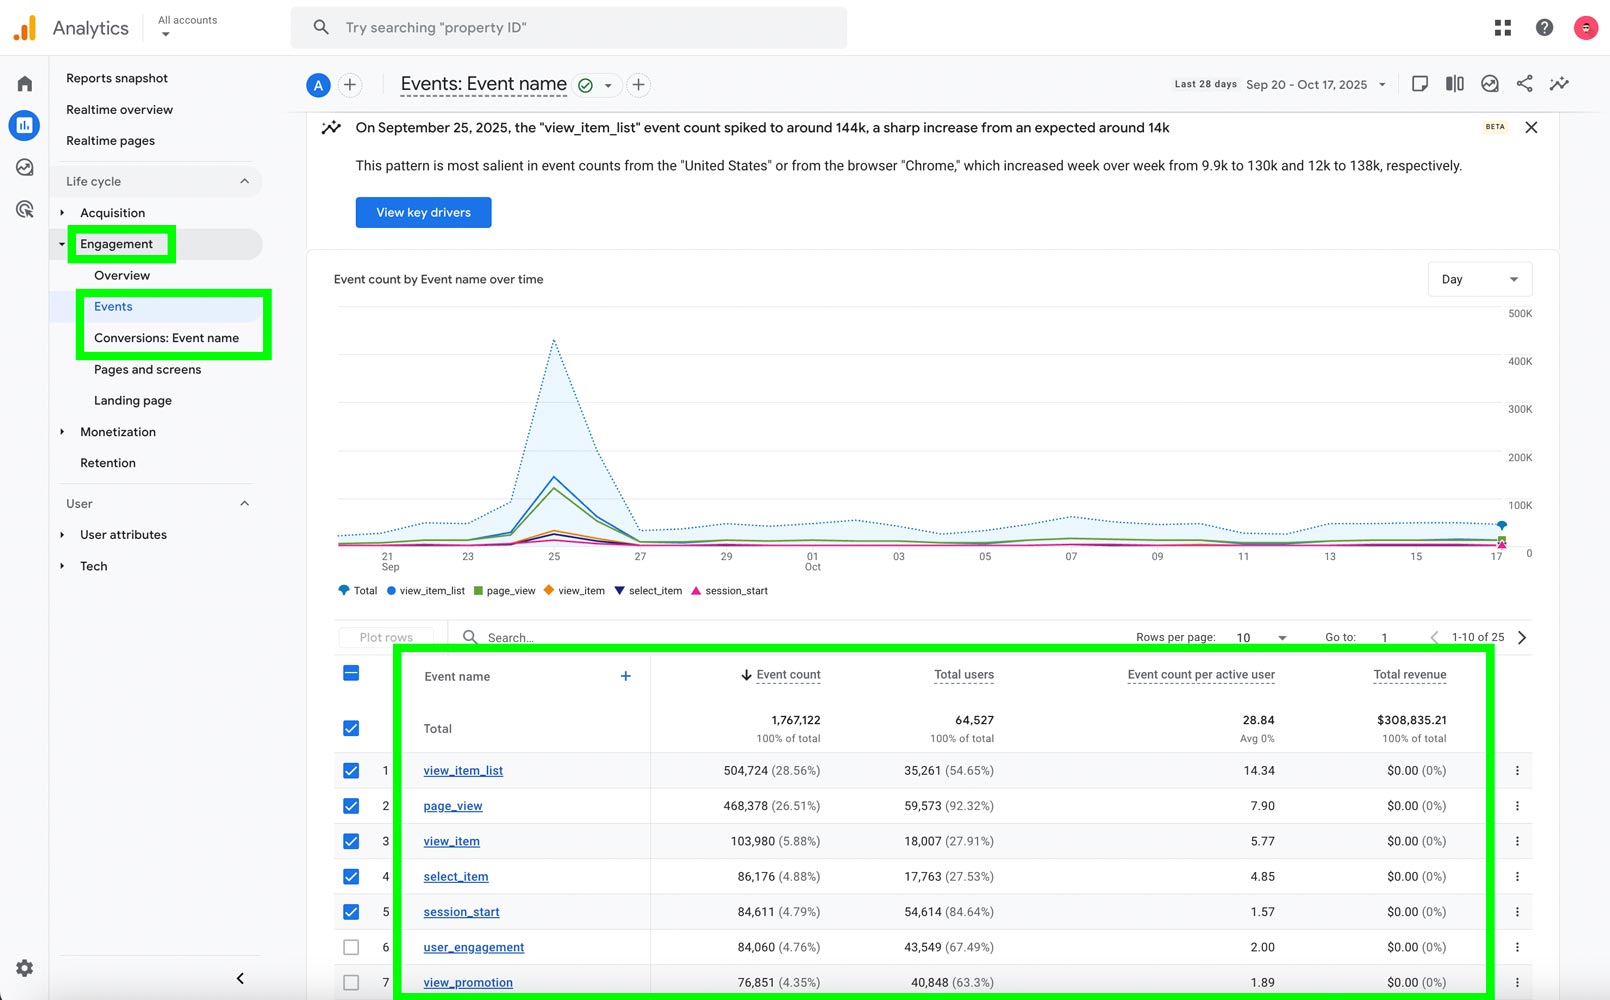
Events And Key Events Report
An event is any action a user takes on your website. For example, view an inventory page or adding product to cart.
A key event is one of the most important actions among all the events on your site. For example, if you’re a hotel, you might track online bookings as a key event.
Measuring the number of events and key events that occur on your website within a specific timeframe helps you understand whether visitors are converting or engaging with your content. These insights show how effective your website and marketing campaigns are, and where you can make improvements.
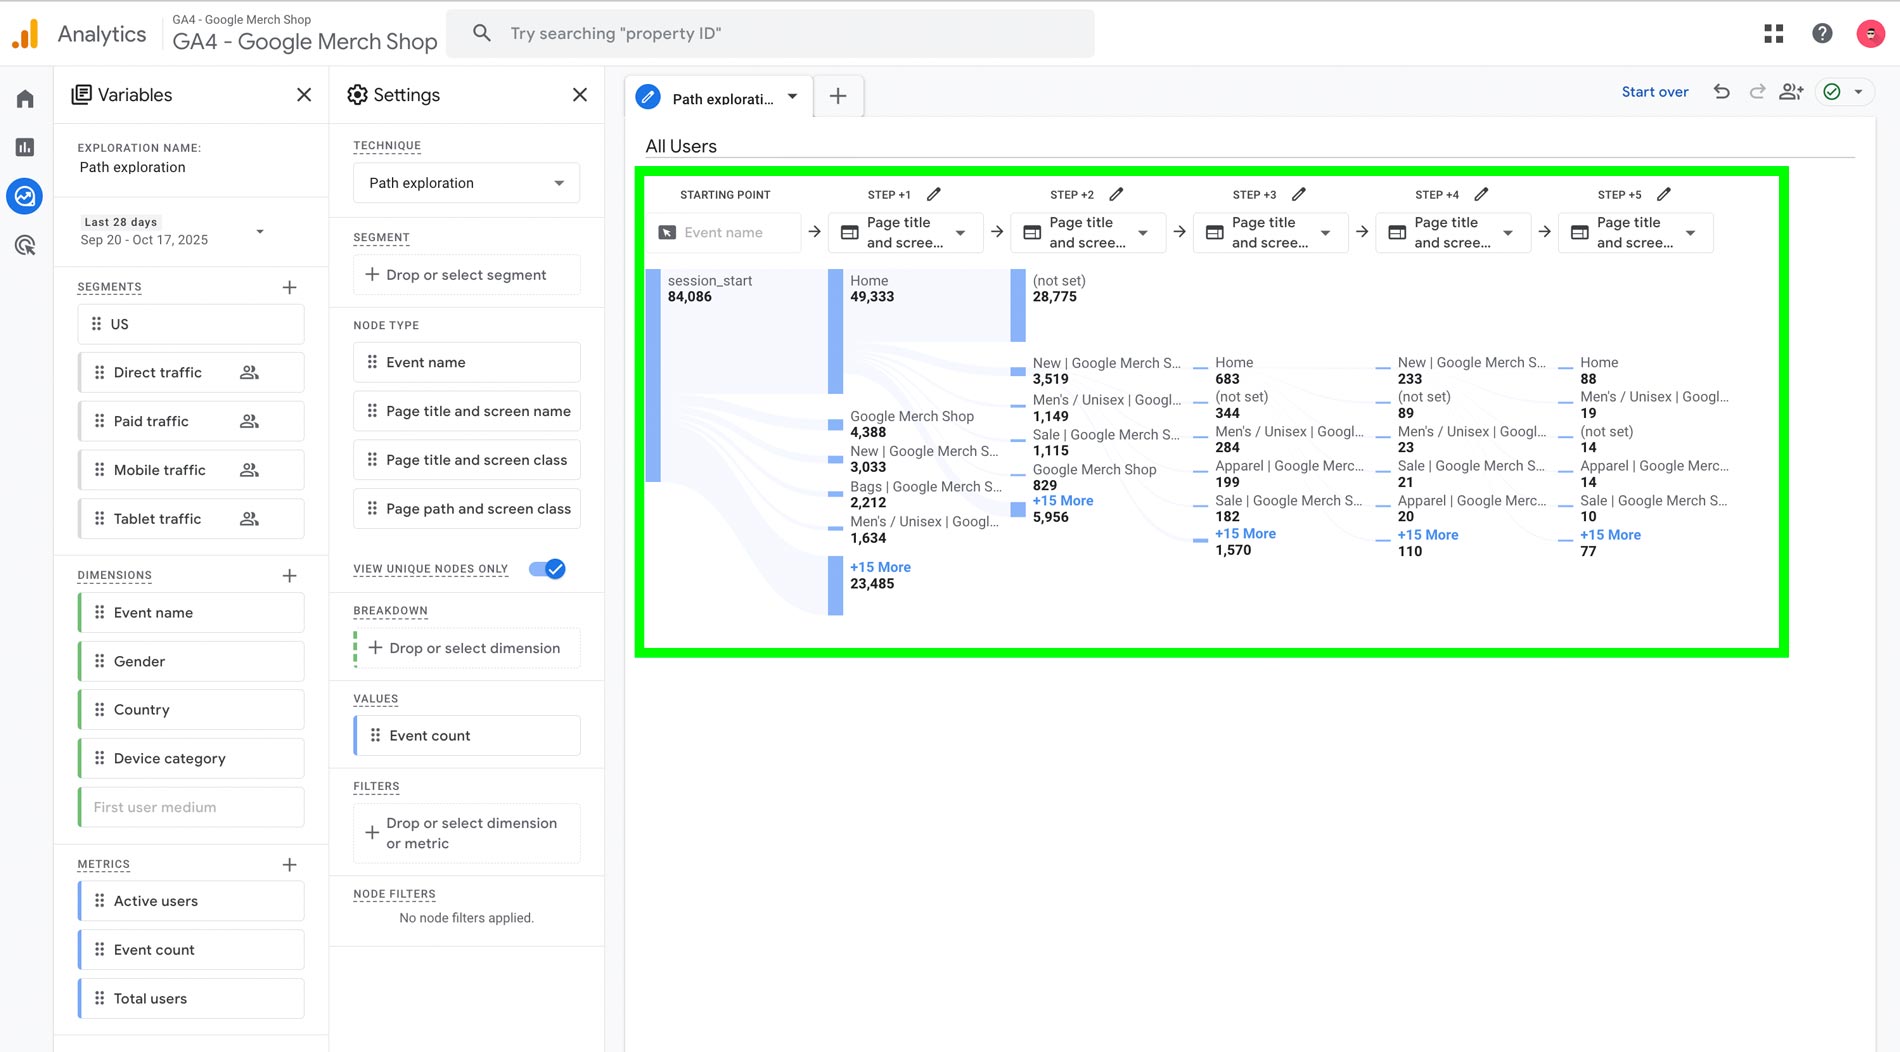
- Path Exploration Report
A Path Exploration report shows how users navigate through your website. This report can highlight whether visitors are moving through the pages you want them to visit, where they’re dropping off, and potential reasons why they might not be converting.
You can use this report to uncover patterns — for example, do users often visit your pricing page but not proceed to checkout? Are they leaving right after viewing your blog content? These insights can help you identify areas where you might improve your site’s structure, content, or calls to action.
The Path Exploration report is a custom report that you can build in the Explorations section of Google Analytics 4.
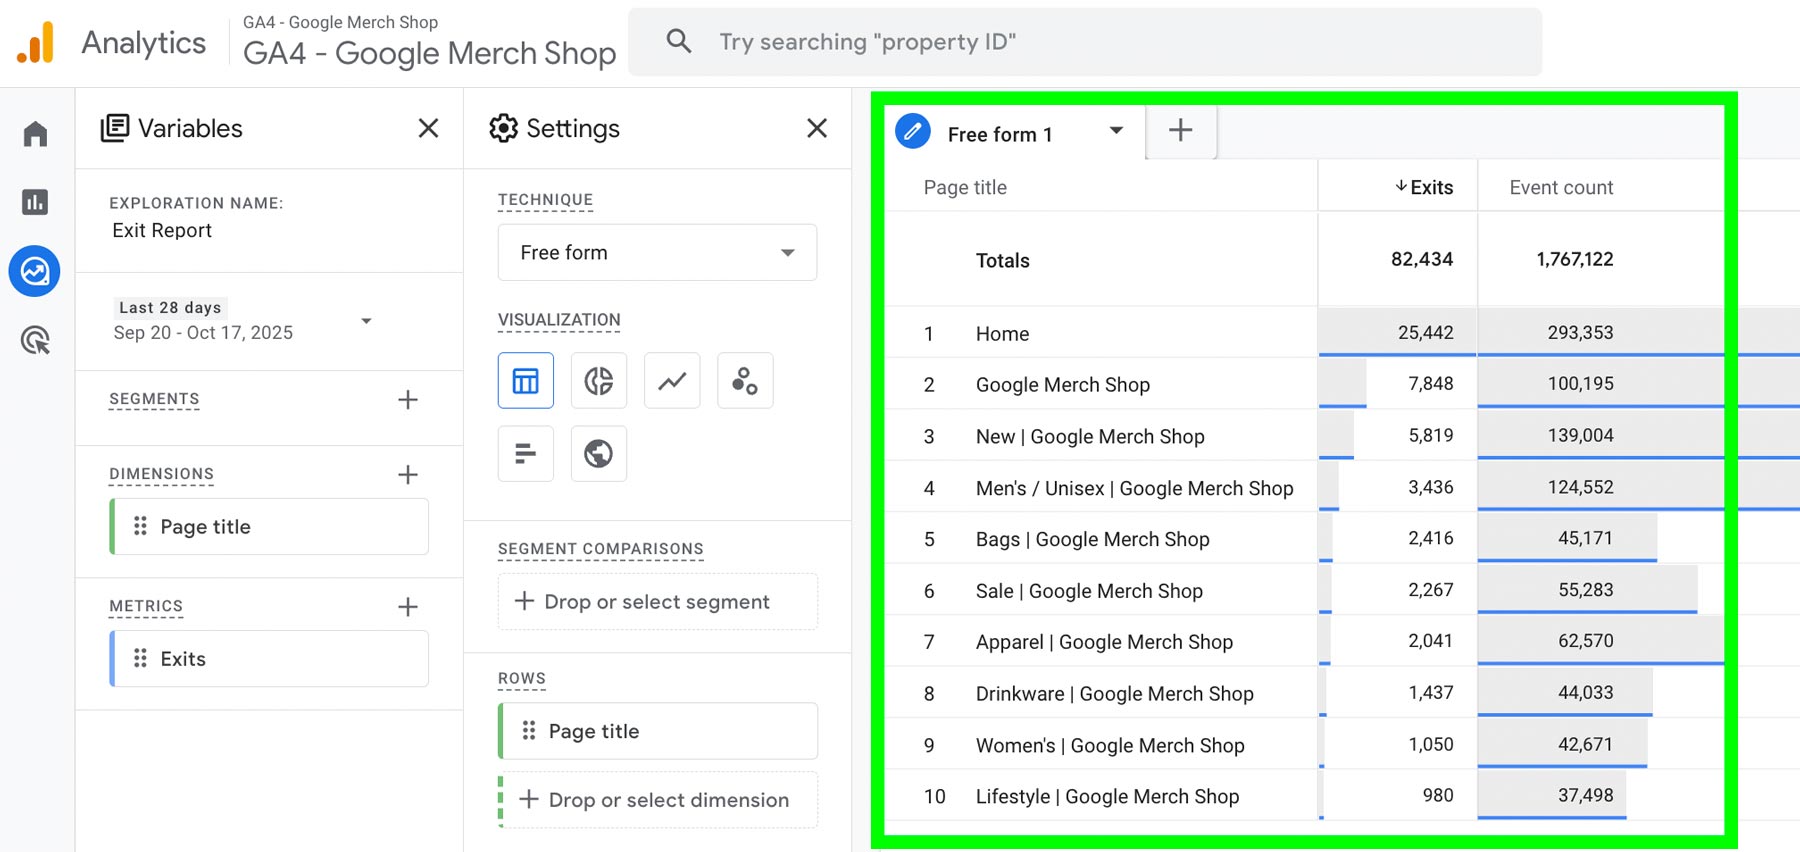
Exit Report
You can create an exploration report to see which pages users are leaving your website from. This type of report is called an Exit Report.
The Exit Report helps you identify why users might be exiting from certain pages. For example, they might not find a clear call to action or next step, causing them to leave your site. By spotting these trends, you can make improvements to your page layout, content, or links to encourage users to stay longer and explore more.
By using these reports in Google Analytics 4, from Landing Pages to Path and Exit Reports, you can gain a deeper understanding of how users interact with your website and content. These insights go beyond surface-level metrics, helping you identify what’s working, what’s not, and where users might be getting stuck. With this data, you can make informed, strategic decisions to improve user experience, increase engagement, and achieve your website goals more effectively.