

Understanding how users navigate your website is imperative for measuring website performance. Fortunately, popular analytics tools such as Google Analytics 4 (GA4) offer useful insights into website user behavior. In GA4, you can visually see your website visitors’ user journey using three different types of GA4 reports.
Before we dive into GA4, let’s grasp the concept of a user journey. Imagine you’re planning a road trip. You start from home, make stops at various landmarks, and eventually reach your destination. Similarly, a user journey is the path a visitor takes on your website, from arrival to conversion or exit.
GA4 provides tools to visualize and understand these user journeys. Here’s a breakdown of four key GA4 reports to visualize user journey.
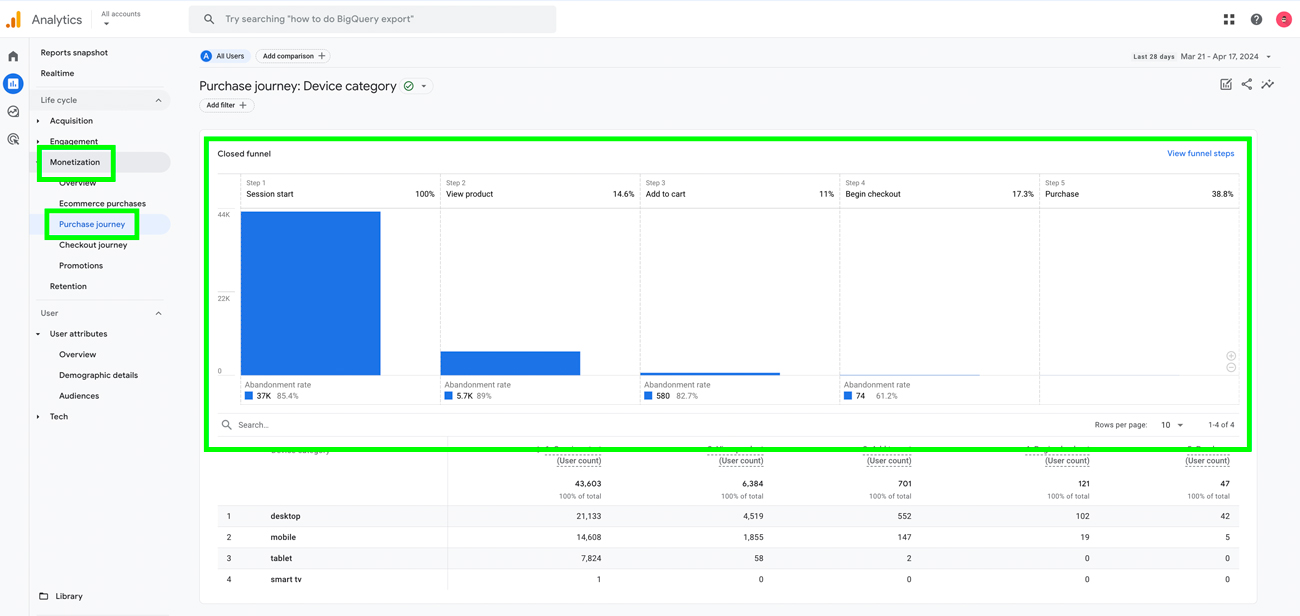
The Purchase Journey report is a feature available within the Monetization section. It visually represents users’ journey from visiting a website to completing a purchase. This journey typically includes visiting a website, viewing a product page, adding items to the shopping cart, initiating the checkout process, and ultimately making a purchase.
The Purchase Journey report provides insights into the number and percentage of website users who visited your website and successfully completed the entire purchase journey, as well as those who start but abandon the process at various stages. By analyzing these metrics, you can identify potential areas for improvement in the overall purchase conversion rate.
Overall, it’s a comprehensive tool for understanding user behavior and optimizing the purchasing experience on your website.
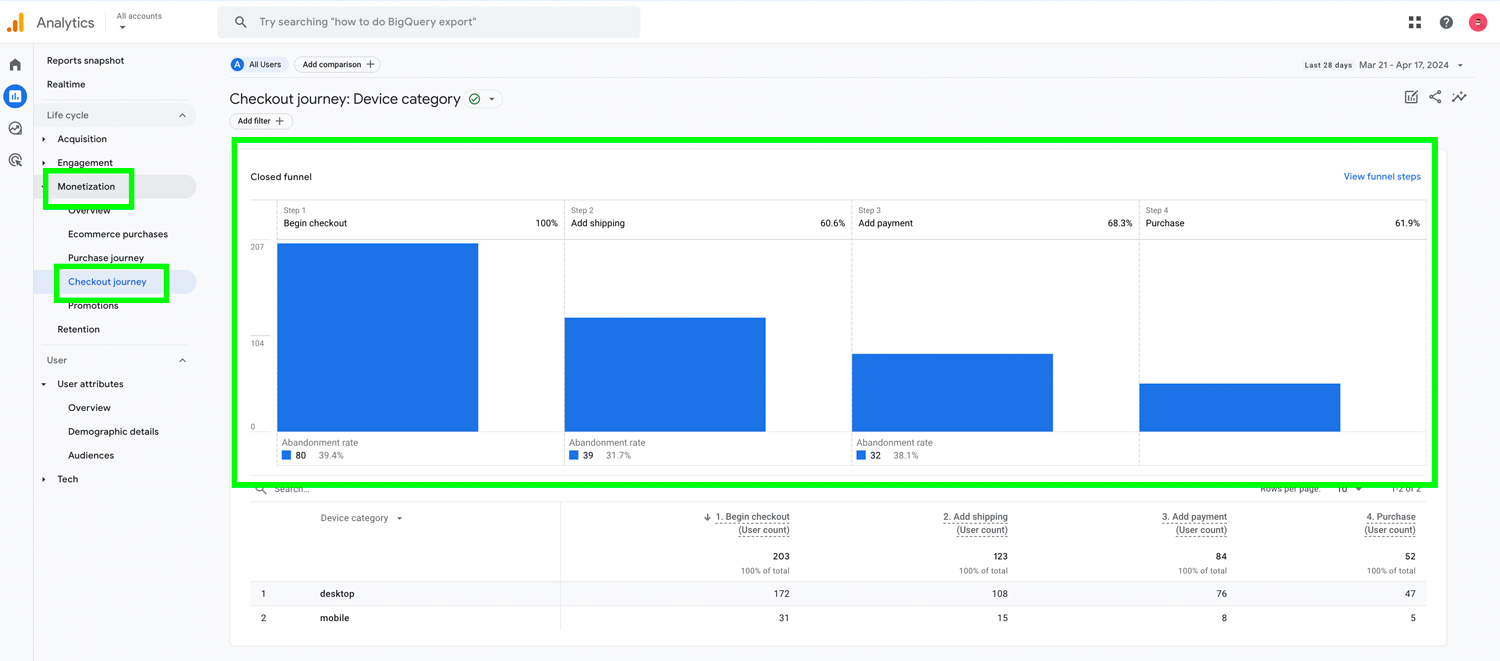
The Checkout Journey report is specific to the eCommerce purchase process. The report begins with users who have initiated checkout and successfully completed their purchases. This report provides a detailed analysis of the checkout process, enabling you to identify opportunities for improving the conversion rate.
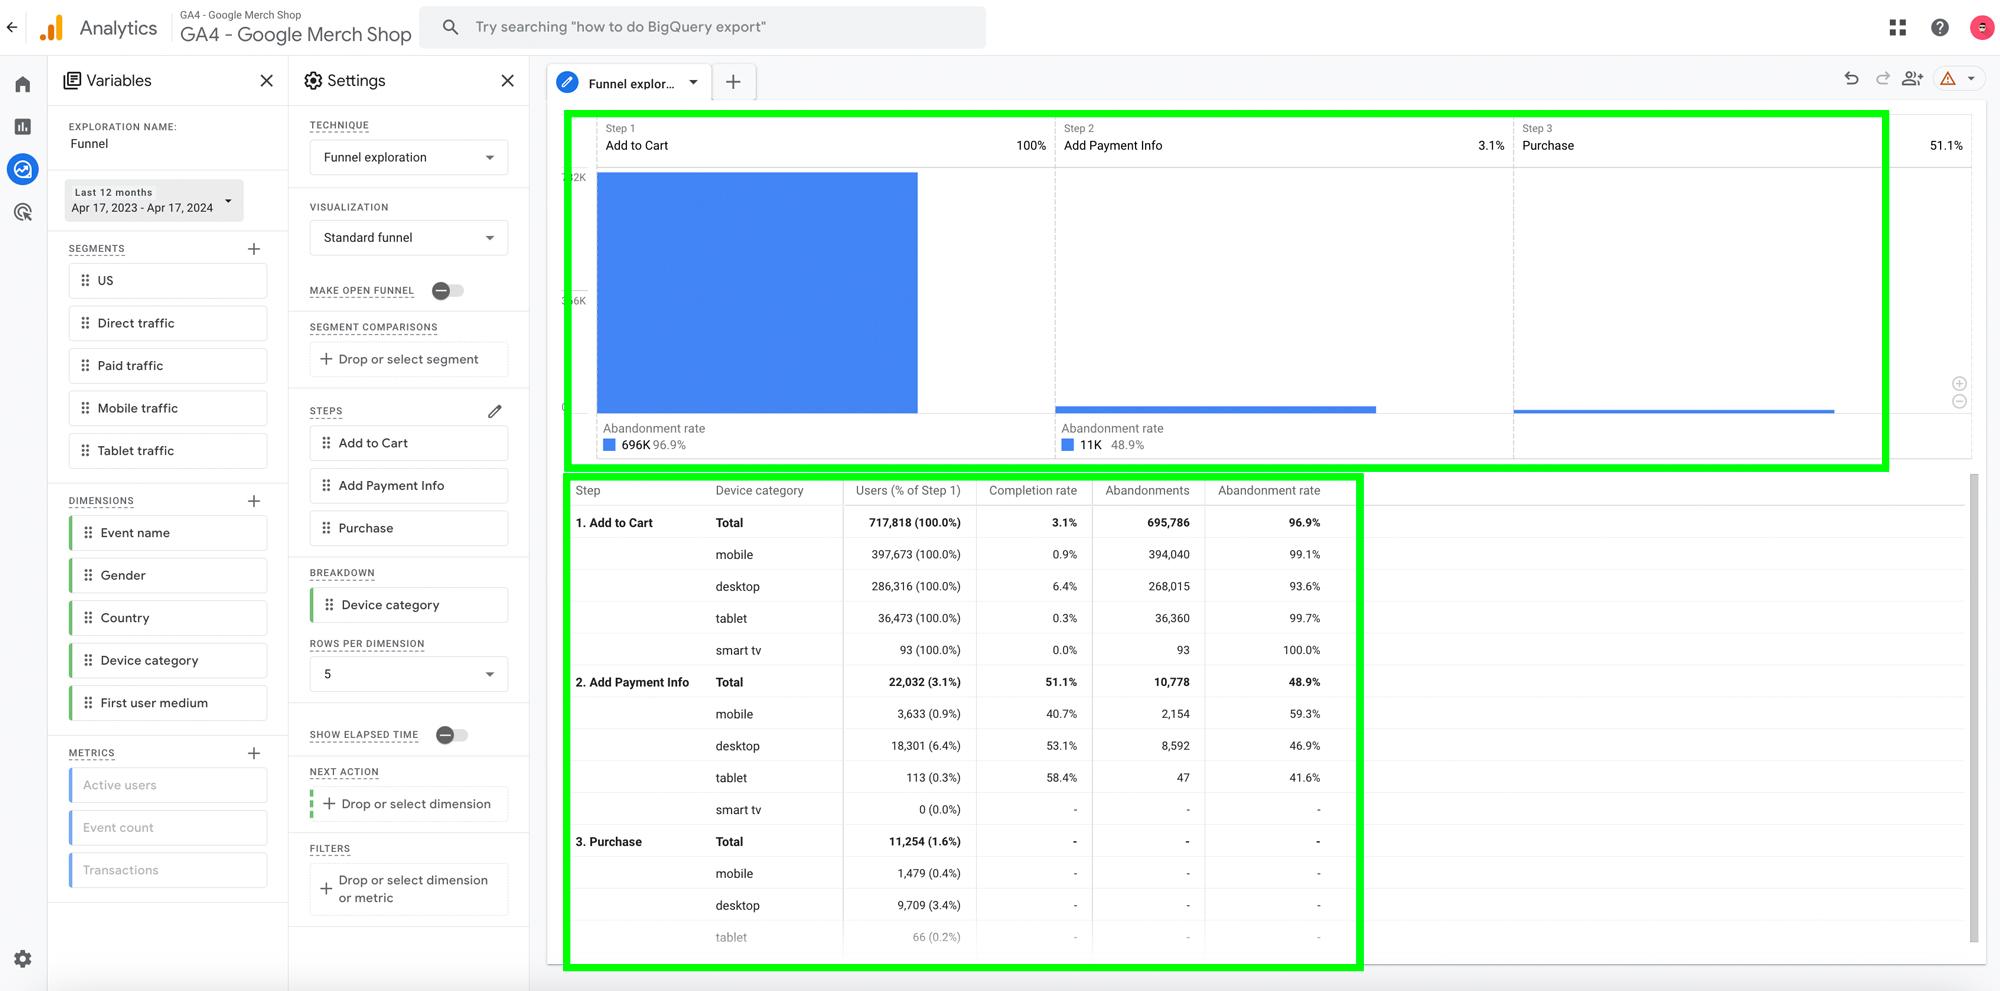
The Funnel Explorations report lets you create custom user journey reports tailored to various dimensions and metrics. For example, you can generate a Funnel Explorations report focused on the checkout process, specifically targeting website users from Toronto or those who visited the website via desktop or mobile devices. This feature offers the flexibility to unravel specific insights according to your needs.
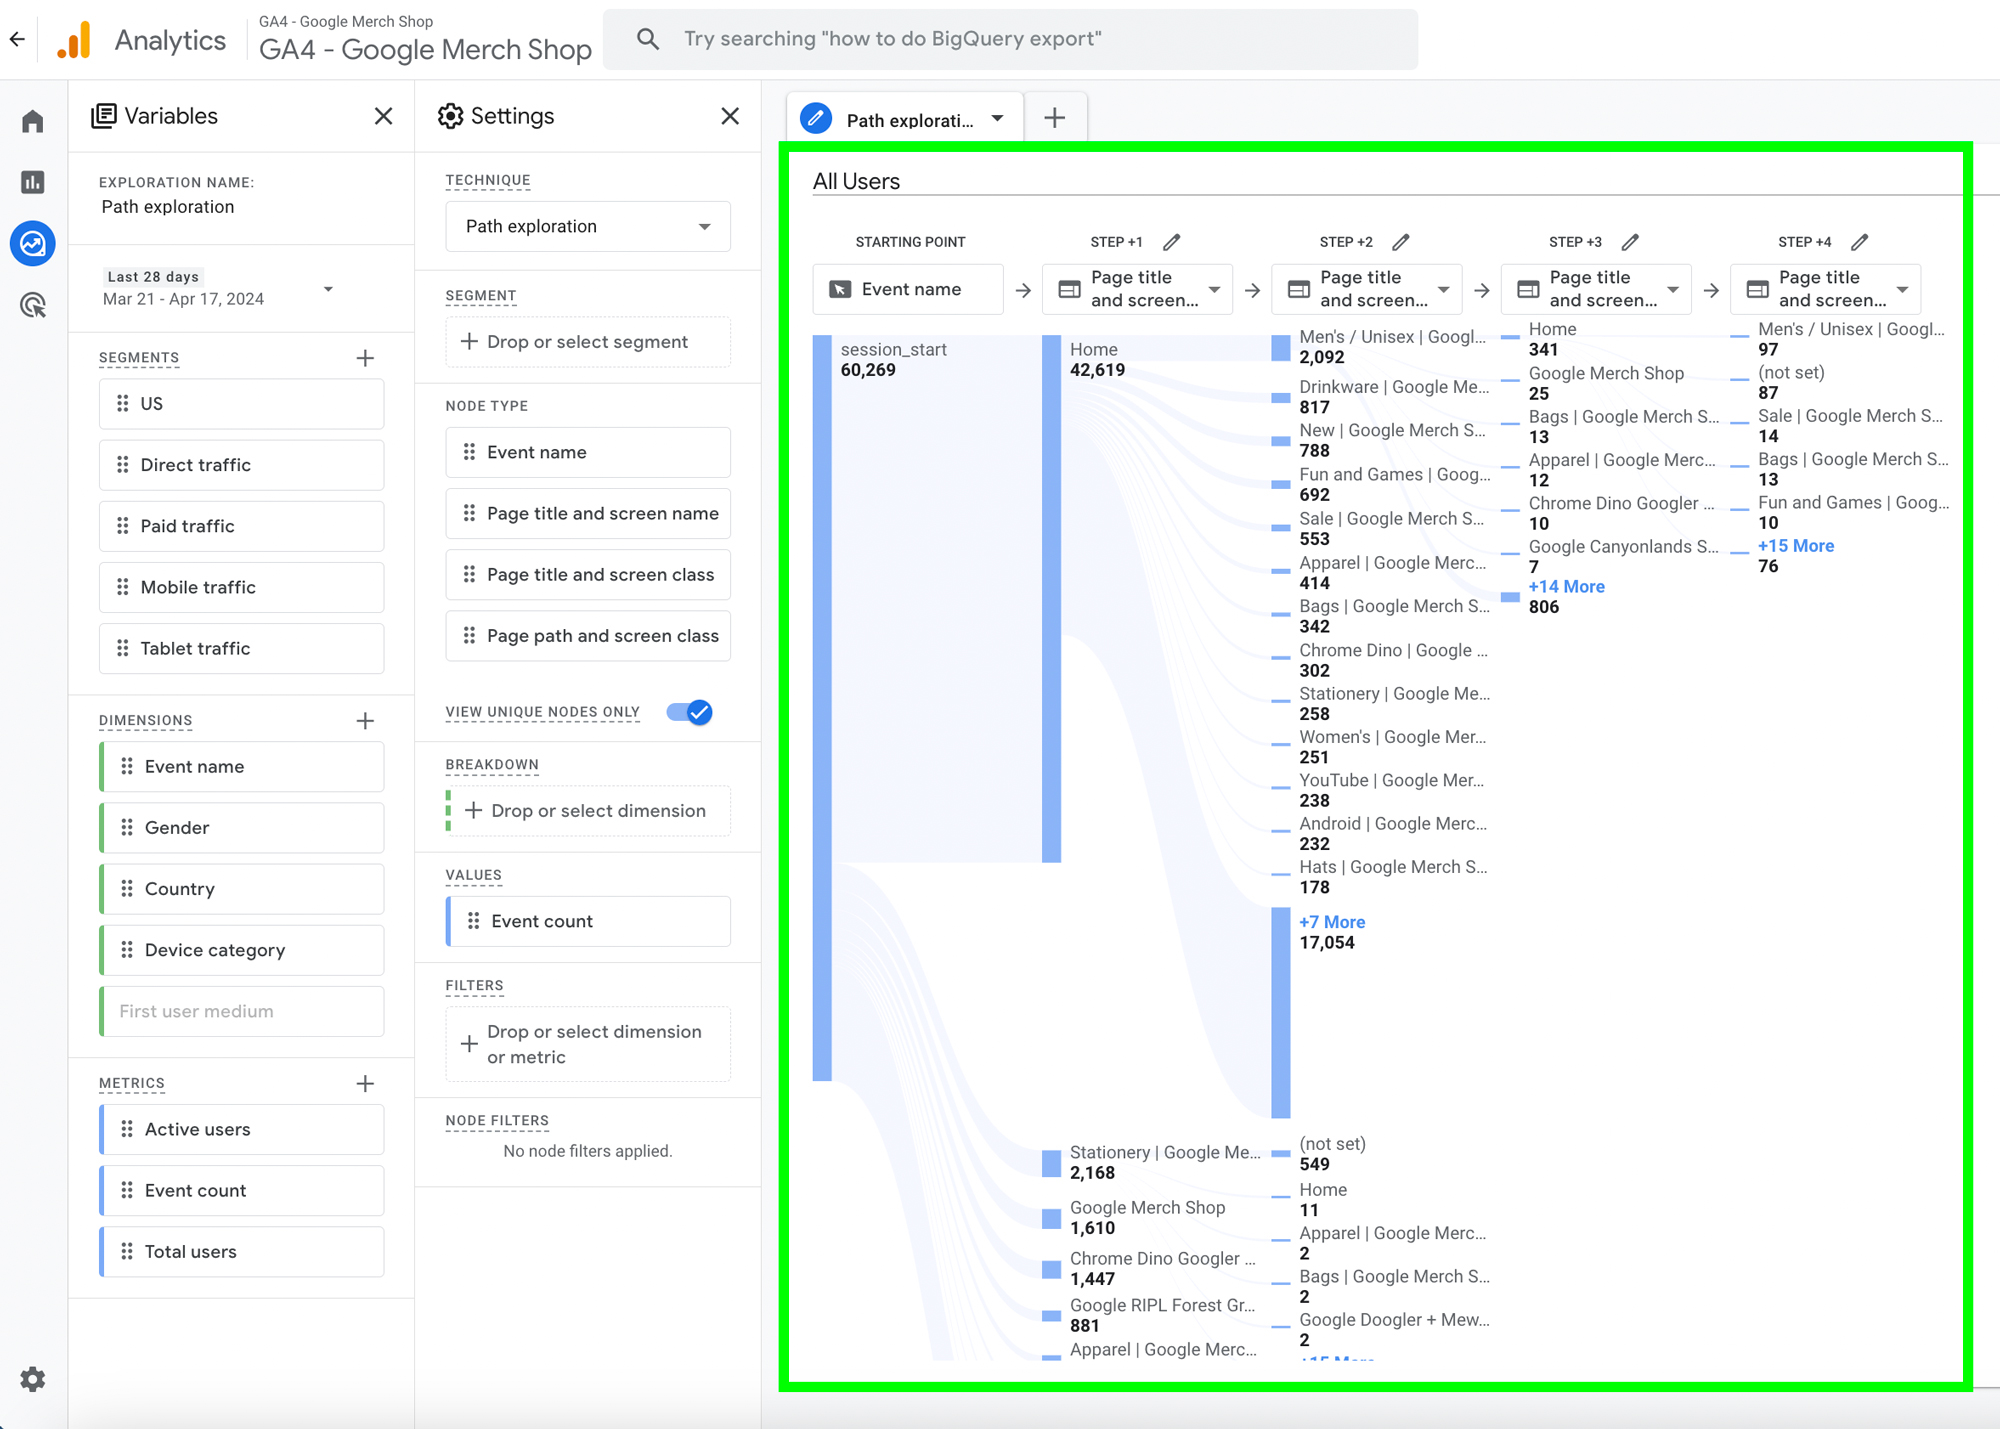
The Path Exploration report provides a comprehensive overview of user journeys on your website, visually illustrating how users navigate through your content. This report is invaluable for understanding user interests, identifying popular content, and evaluating the overall user experience. Additionally, it helps pinpoint potential bottlenecks that could hinder the website’s performance and user satisfaction.
Understanding and analyzing user journeys are essential for optimizing website performance and enhancing user experience. GA4 offers powerful tools to visualize these journeys and gain valuable insights into user behavior.
By using features such as the Purchase Journey report, Checkout Journey report, Funnel Explorations, and Path Exploration, marketing teams can gain a deeper understanding of how users interact with their site. These reports provide valuable metrics and visualizations that help identify areas for improvement, optimize conversion rates, and enhance overall user satisfaction.